The problem: reactive power, cos φ, harmonics, load variations
The origin of reactive power
Most of the consumer’s installations take active and reactive power from the electrical network. The active power is converted into mechanical power, while the reactive power is needed to establish and remove the magnetic fields of motors, transformers and reactors. However, power converters and other phase-angle controlled devices likewise require reactive power. Far more than 50% of the total reactive power requirement is caused by motors. The reactive power oscillates between the generator and the load. The apparent power results from the active and reactive power (product of voltage and current). The power factor cos φ indicates the ratio between active and apparent power. In case cos φ is 1, only active power is transferred.
Loaded electrical network
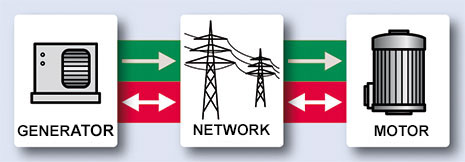
Green – active load, red – reactive power
Negative effects of reactive power
Electricity producers and network operators have to make the apparent power S (see figure) available and transmit it.
This means that generators, transformers, power lines, switchgears as well as consumer´s installations have to be dimensioned
for the greater apparent power rating.
Power utilities as well as the power consumers are therefore faced with a substantial extra expenditure for equipment
and quite significant additional power / heat losses.
As a result, the utilities partially or fully charge for the costs of reactive power.
The lower the cos φ, the higher are the loads on all equipment in the electrical network, CO2 emissions and the electricity bill.
Reactive power
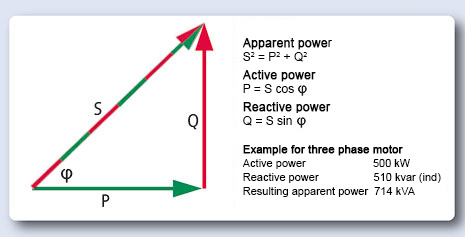
Although the mechanical effect of the motor requires only 500 kW, the electrical network is loaded with an apparent load (S) of 714 kVA, i.e. with 143% of the active load (P).
Harmonics
The increase of equipment with non-linear characteristics (e.g. power electronics),
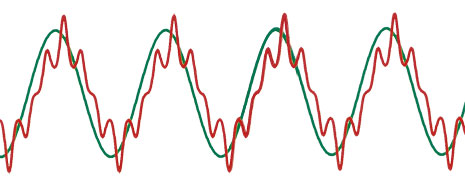
which withdraw a non-sinusoidal current from the electrical network with sinusoidal voltage, leads to higher harmonics load.
Harmonics are currents with an integral multiple of the electrical network frequency (50 or 60 Hz). In practice, currents up to the 50th harmonic may be significant.
The 5th (250 Hz), 7th (350 Hz), 11th (550 Hz) and 13th (650 Hz) harmonics have the highest importance for electrical network and equipment.
However, the 3rd and 9th harmonics are likewise becoming more significant.
The total harmonics distorsion is indicated in percentage (%) THDU or THDI. The higher the THDU or THDI, the higher is the electrical network and equipment load.
Negative effects of harmonics
Harmonic currents represent an additional load on all electrical equipments. The consequences may be:
- Increased energy costs resulting from power/heat losses
- Faults in communication and control systems
- Shaking moments and irregular operation of electric equipment
- Reduced lifetime
- Overloading of electric equipment
- Deficient product and process quality
- Higher CO2 emissions
Symbolic representation of a electrical network loaded with reactive current and harmonics
Fast load changes
The load dynamic in industrial and commercial electrical network is constantly increasing. In many cases, a relatively moderate base load goes along with a small number of large consumers with highly dynamic load characteristics.
Consumers with a rapidly varying load, such as welding equipment, kneading machines, crane systems etc., cause large active and reactive power variations.
Negative consequences of fast load changes
- Excessive impulsive over-currents
- Unstable voltage conditions
- Unbalanced phases
- Increased losses
- Increased equipment costs
- Flicker voltage fluctuations
- Deficient product and performance quality,
- Higher CO2 emissions
Capacitive electrical network load
In electrical networks with a large amount of cables, solar or wind generation or other high connected loads, which operate with a cos φ close to 1, a capacitive cos φ may occur at certain times of the day due to the capacitive charging power of the cables.
Negative effects of the capacitive load
The effects are similar as with an inductive load. In addition, there is a risk of voltage increases or drops leading to the known negative consequences.
The solution: Power factor correction
The unloaded electrical network
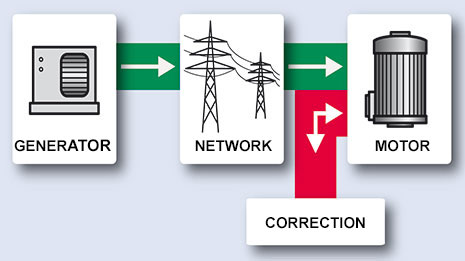
If the inductive or capacitive reactive power is locally compensate, e.g. by a capacitor, a reactor or an automatic power factor correction system, the delivery of reactive power from the utility is omitted partially or fully. The power factor correction is most effective, if it is close to the consumtion and timely manner.
Power factor correction
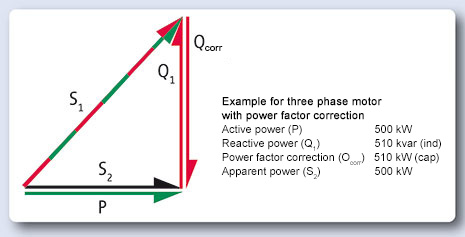
In the given example, the motor consumes an active power (P) of 500 kW; the reactive power (Q1) of the motor is fully compensated by Qcorr and the electrical network is loaded now with an apparent power (S2) of 500 kVA, 100% with active power. The power factor correction leads to an unloading of 43% (from 143% to 100%, related to the active power rating).
The economic advantages of power factor correction
Savings of reactive power costs
Following example, an industrial company with an average power of 500 kW, an average cos φ of 0.7 and 4000 operating hours per year is used.
The power supply tariff currently still allows the user to draw 50% of the active power as reactive power at no extra charge,
corresponding to a target cos φ of 0.9.
By employing a compensation system from SYSTEM ELECTRIC, the investment often pays back within the first year.
This demonstrates the enormous economic efficiency of power factor correction.
Additional savings from active power costs by reducing the losses
The previously shown company has, like every other power consumer, power losses in its own distribution network and pays for active power. The use of a power factor correction system reduces the apparent power in the electrical network of the companyand hence also the power losses. In addition to saving reactive power costs, the power factor correction system also reduces the costs for the active power, i.e. all the more as the cos φ is increased.
Energy bill
| Energy daily tariff 2,000,000 kWh | ||
|---|---|---|
| Reactive power | Daily tariff | 2,040,408 kVArh |
| Reactive power | No charge | 1,000,000 kVArh |
| Reactive power | Chargeable | 1,040,408 kVArh |
| x 0,013 Euro / kVArh | = | 13,525,- Euro |
Required power 268 kVAr |
||
| Selected system | 12 x 25 = 300 kVAr, 5.67% de-tuned | |
| Investment including installation | = | approx. Euro 8,800 |
| Payback time | = | approx. 8 months |
| If billing is based on a supply tariff and intended for optimum electrical network unloading, a compensation to a target cos φ close to 1 can be reasonable. | ||
Lowering of investment costs
The previously shown company is planning to increase its consumption by 200 kW from 500 kW.
The existing transformer with a rating of 800 kVA has been adequate to date, but it would be overloaded after the plant expansion.
An extension of the power infrastructure with a transformer, switchgear, cabling, distribution board, etc. would be necessary.
In this case the apparent power can be reduced by using power factor correction system beyond the required cos φ of 0.9
so that the existing infrastructure is still sufficient. Such a power factor correction system is significantly less expensive than a
electrical network expansion and would likewise save energy costs.
An innovative, network-optimizing power factor correction can do more
Improvement of voltage quality, supply and process reliability
Further significant positive effects can be achieved by employing de-tuned and dynamic power factor correction systems.
An optimzed design (capacitive, inductive or both) of such equipment, network pertubations can be reduced significantly.
These positive effects substantially depend on the ideal reactor protection, the reaction velocity and the intelligence of the controller.
But also the energy-efficiency, i.e. the power consumption, should be a criterion for the selection of a power factor correction system.
SYSTEM ELECTRIC systems garantee a high energy efficiency.
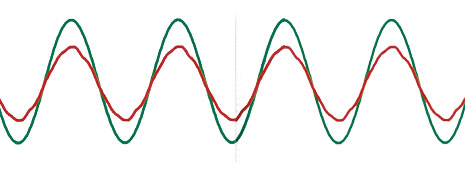
Schematic of a electrical network relieved from reactive power
and harmonics
Unloading of electrical network, CO2 reduction
As previously mentioned in connection with the additional transmission losses, power factor correction relieves the electrical network from the avoidable transport of reactive and active power. It is currently becoming ever more obvious that the electrical networks have reached their limits due to the growing cross-border exchange of electricity and the growing supply of solar and wind energy from remote locations.
Although power factor correction is basically not able to replace electrical network expansions durably, but bottlenecks would be alleviated and precious time would be gained for the expansion due to the free line capacity accomplished through an optimized use of power factor correction or an increase of the target cos φ close to 1. In addition, the CO2 emissions would be reduced considerably. A target cos φ close to 1 would also contribute to environmental protection
The advantages of an innovative, network-optimizing power factor correction
at national level
Power losses – status and potential in Germany
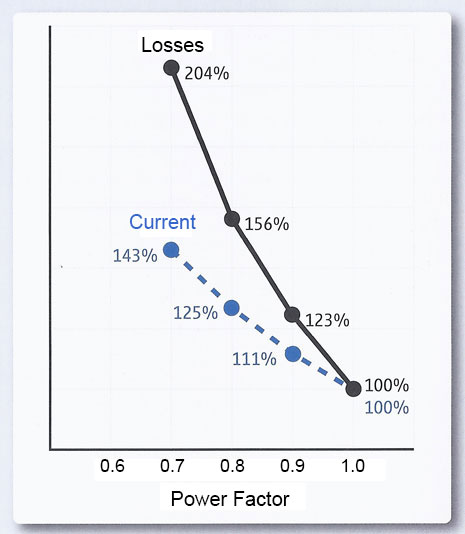
Through power factor correction, the apparent power and proportionally the current load in the electrical network is reduced.
Rule of thumb: 5% less current > 10% reduced losses.
One measure for the reactive power in the electrical network is the power factor cos φ.
In the adjacent diagram, current load and losses are standardized to 100% with a cos φ of 1,
i.e. a full power factor correction.
The lower the power factor, the higher are reactive power, current load and losses.
These applies to the energy customer’s own electrical network (industrial or special contract customers)
as well as to the public transmission and distribution networks.
The hugh unloading potential offered by a cos φ close to 1 becomes visible.
More comprehensive information about this topic can be found in the study: "Contribution of industrial power factor correction systems and consumers for an innovative reactive power management in Germany’s power supply" issued by the ZVEI Power Capacitor Association.
Power load and losses depending on the power factor
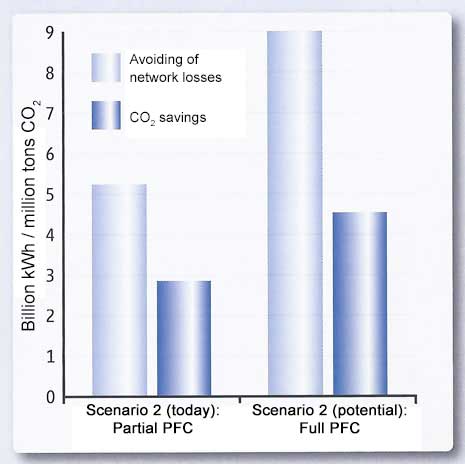
Power factor correction reduces the electrical network losses in Germany and the CO2 emissions
The influence of power factor correction on the electrical network losses is considered according to three scenarios:
| Scenario 1: Without PFC | Scenario 2: Partial PFC | Scenario 3: Target PFC |
|---|---|---|
| Losses without the existing power factor correction systems | Current status with partial power factor correction using a power factor of 0.90 | Losses with power factor correction using a power factor of 0.95 |
The comparison of Scenario 2 and Scenario 1 shows:
|
||
The comparison of Scenario 3 and Scenario 2 shows:
|
||
| Through optimum electrical network unloading to a power factor of cos φ › 0.95 up to close to 1, considerable savings can be achieved regarding the losses as well as the CO2 emissions. | ||
Power Factor correction in Germany
